Tools and Resources
Making smart data accessible to everyone
We produce visualisations, maps, dashboards and tools to make our data and insights accessible, helping everyone to understand the place they live a little better.

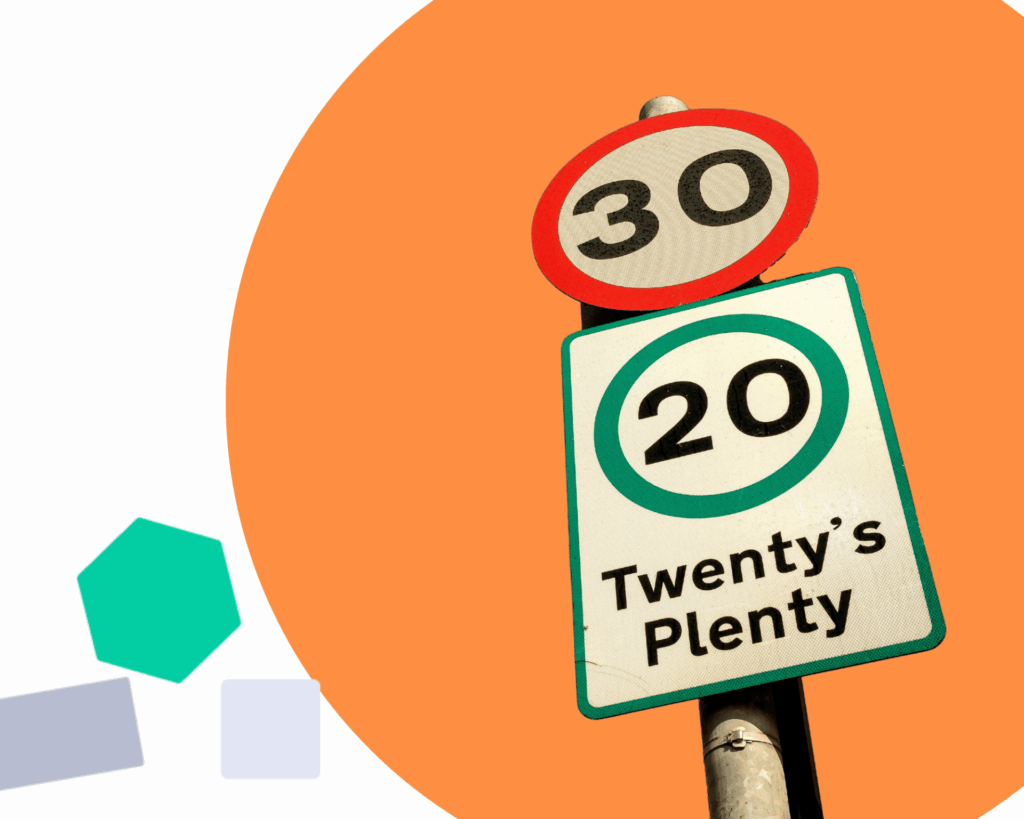
Speeding Dashboard
Use our map-based tool to explore speed limit adherence of goods vehicles in 13 city regions – Cambridge, Cardiff, Edinburgh, Glasgow, Greater Manchester, Liverpool, London, Newcastle, Oxford, South Yorkshire and West Midlands.
Explore the dashboard
Priority Places for Food Index
Explore our interactive Priority Places for Food Index map to identify areas most likely to need support to access affordable, healthy, and sustainable sources of food.
Explore the index
Nutrient Profile Model Calculator
Use our Nutrient Profile Model Calculator – a quick, easy and transparent way to generate a product’s NPM score, and check if it may be captured by HFSS legislation.
Use the calculator
Planet Plates Game
Different foods have different carbon footprints from every step of production. See if you can spot some low carbon meals in our interactive Planet Plates Game!
Play Game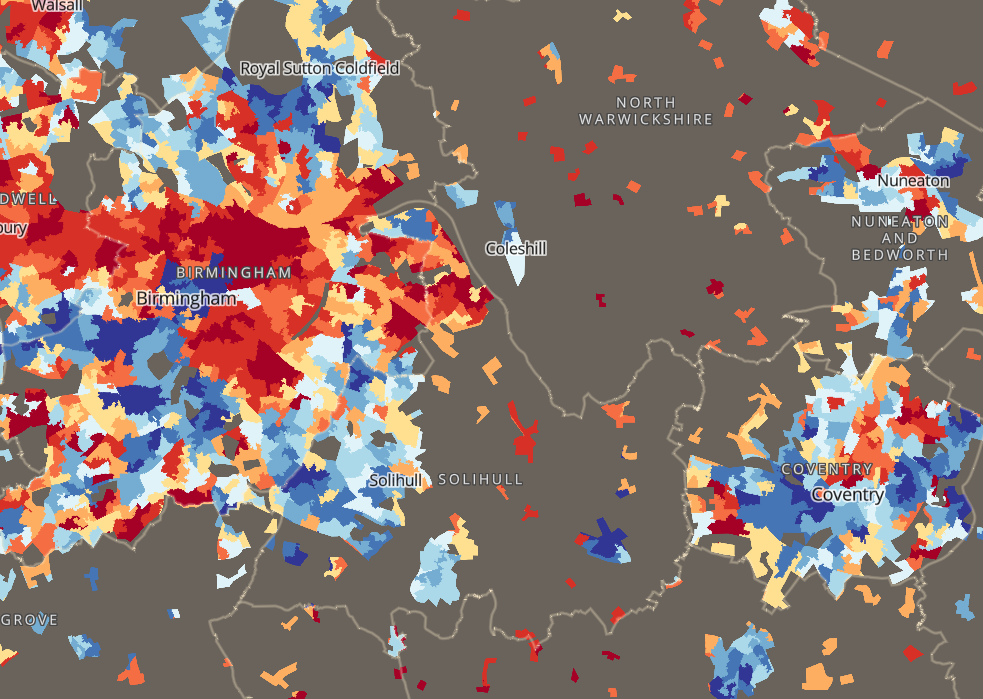
E-food Desert Index
Deep dive into food deserts with the E-food Desert Index map – an interactive tool which can identify priority areas for grocery and e-commerce accessibility.
Explore the index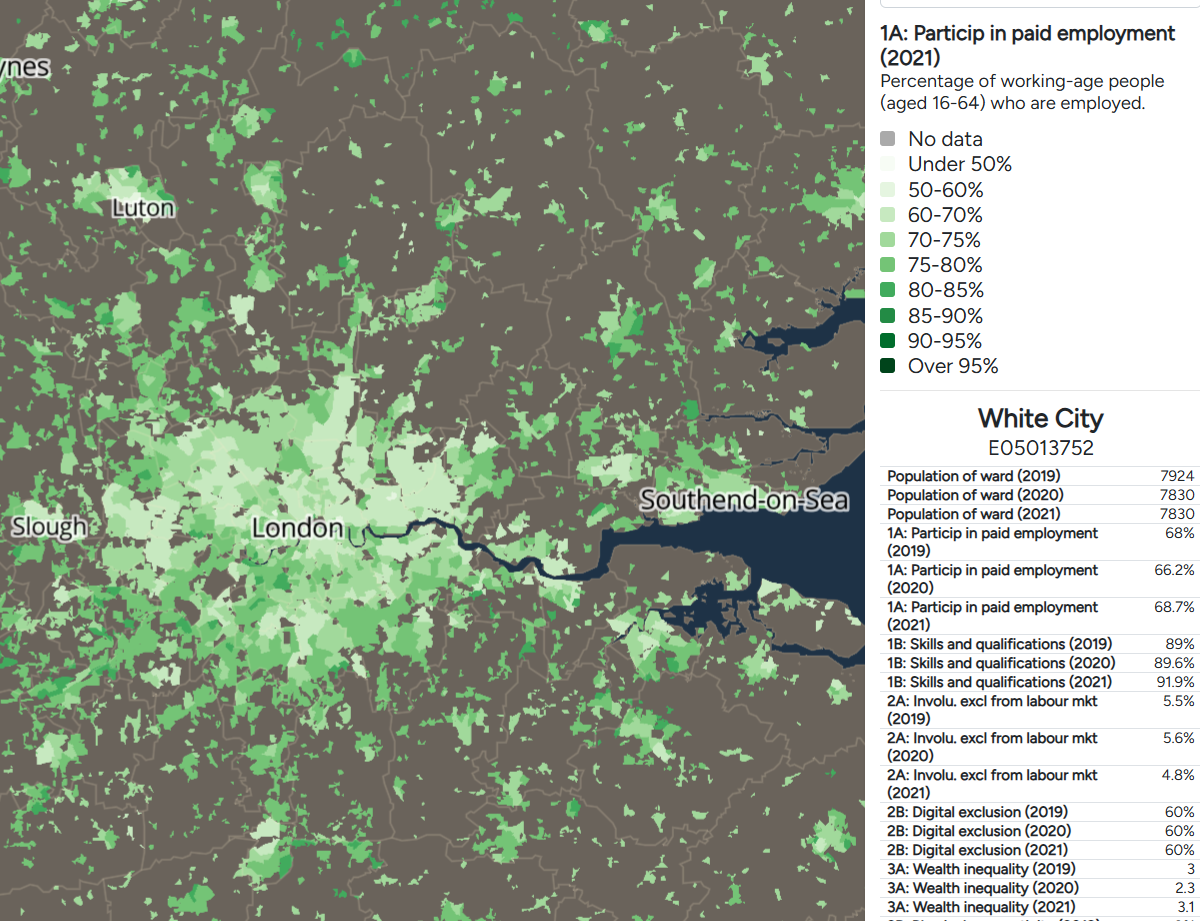
SIPHER Inclusive Economy
With our user-friendly and code-free visualisation tool, explore 22 metrics of economic accessibility and participation across nearly 8,000 wards in Great Britain.
Discover the data
Mapping Advertising Assets Project
Explore the healthfulness, counts, and locations of outdoors advertisements across 30 neighbourhoods in Leeds using the Mapping Advertising Assets Project tool.
Access the tool
Priority Places for Insulation Index
Co-developed with Which?, use the Priority Places for Insulation Index to explore insulation needs, property conditions, and local population features down to the LSOA level.
Explore the index