
Recent cycling infrastructure development in the UK
Cycling is a sustainable mode of transport that can help alleviate congestion and reduce air pollution, while cyclists are threatened by increasingly complex traffic environments. The British government has committed to making significant investments in the installation and improvement of cycling infrastructure over the last two decades.
Three common types of cycle lanes in the UK are painted cycle lanes, temporary protected cycle lanes, and permanent protected cycle lanes. Protected cycle lanes have become increasingly popular since the early 2020s.
Policymakers expect that physically separating cyclists from motor traffic will create safer cycling environments and encourage cycling uptake at the population level.
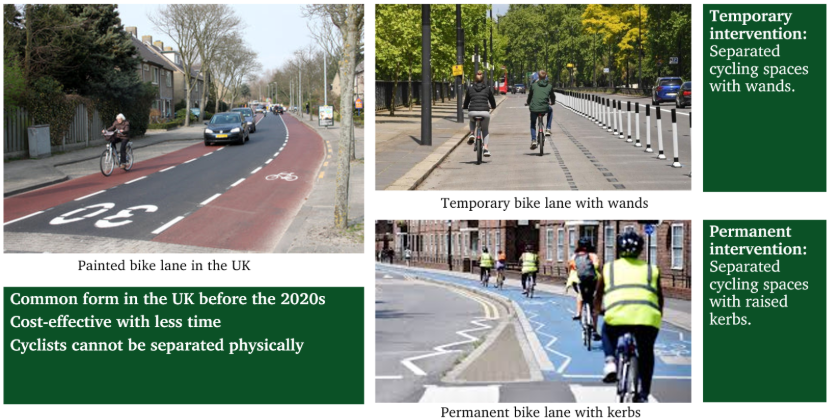
However, protected cycle lanes also require greater investment because they involve more substantial physical modifications, such as installing kerbs and resurfacing roads. The estimated investment in protected bike lanes is around 1 million pounds per kilometre, but evidence on their effects on cycling uptake remains limited, creating uncertainty about justifying additional investment.
Furthermore, recent bike lane projects have faced resistance or opposition from local residents, property owners, and other stakeholders, potentially due to the loss of parking spaces and uncertainty about their interest (e.g., commercial prosperity and disamenity). Solid evidence of the effects of bike lanes on cycling behaviour is therefore crucial to inform future policy decisions.
How does cycling infrastructure change cycling behaviours for Strava users?
Traditionally, collecting daily mobility information from individuals has been both financially and labour-intensive. The emergence of smart data, such as link-level cycling flow information in the Strava dataset, has provided new potential. Aggregated and crowdsourced longitudinal mobility data reveal population-level behaviours before and after the bike lane interventions.
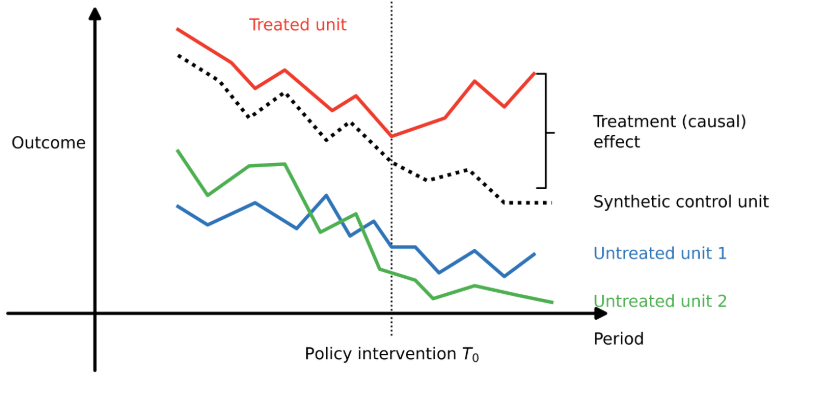
Using Strava data, we applied the synthetic difference-in-differences (SDID) method to estimate the intervention’s effect on cycling activity by comparing treated street segments with control streets before and after the intervention.
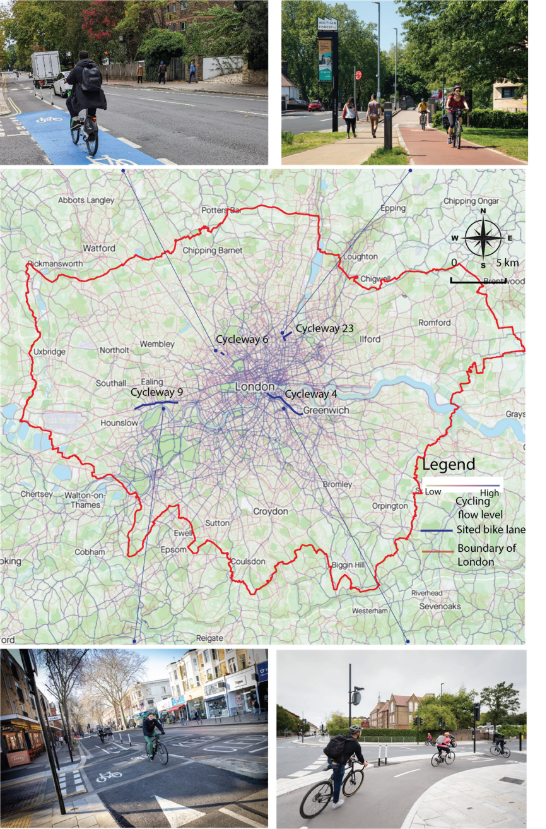
Our preliminary analysis examined segments of four protected cycle lane schemes introduced in London, UK, between 2021 and 2025. We found robust evidence of positive effects for three protected bike lane projects, and no detectable effect for the remaining one.
Estimated average treatment effects on recorded cycling activity ranged from 13% to 90% following the opening of the cycle lanes, although not all estimates were statistically significant.
Comparisons with control groups indicated that no consistent differences by age, trip purpose, gender, or time of day across the four schemes.
These findings suggest that protected bike lanes may increase cycling activity of the treated segments among Strava users, although their effects vary across specific schemes. They provide preliminary support for further investment in protected cycling infrastructure in the UK.
Moreover, the evidence does not establish whether the schemes broaden participation among underrepresented cyclists, such as women. Further evidence and more detailed smart data are needed to assess what complementary measures are required to achieve more inclusive cycling uptake.
Reference:
Pellicer-Chenoll, M., Antón-González, L., Villarrasa-Sapiña, I., Devís-Devís, J., González, L.-M., & Pans, M. (2025). Effects of building cycling infrastructure on bicycle use: Differences by gender through a longitudinal natural experiment study. Research in Transportation Economics, 110, 101531.
Rein-Sapir, Y., & Hickman, R. (2026). Controversial cycle lanes: lessons from Cycleway C9, Chiswick High Road. Journal of Environmental Policy & Planning, 28(2), 307-325.