
The Healthy and Sustainable Places Data Service has launched a new interactive dashboard to support analysis of how inclusive local economies have been across Great Britain.
The tool, a collaboration between HASP and the SIPHER consortium, visualises 13 indicators that together describe different dimensions of economic inclusion at Local Authority District level. Covering the period from 2017 to 2021, the dashboard enables users to explore historic patterns and compare outcomes between places, supporting research, analysis and policy development.
- Participation in paid employment
- Decent pay
- Skills and qualifications
- Involuntary exclusion from the labour market
- Digital connectivity/inclusion
- Housing affordability
- Physical connectivity
- Poverty
- Cost of living
- Inclusion in decision making
- Job security
- Wealth inequality
- Earnings inequality
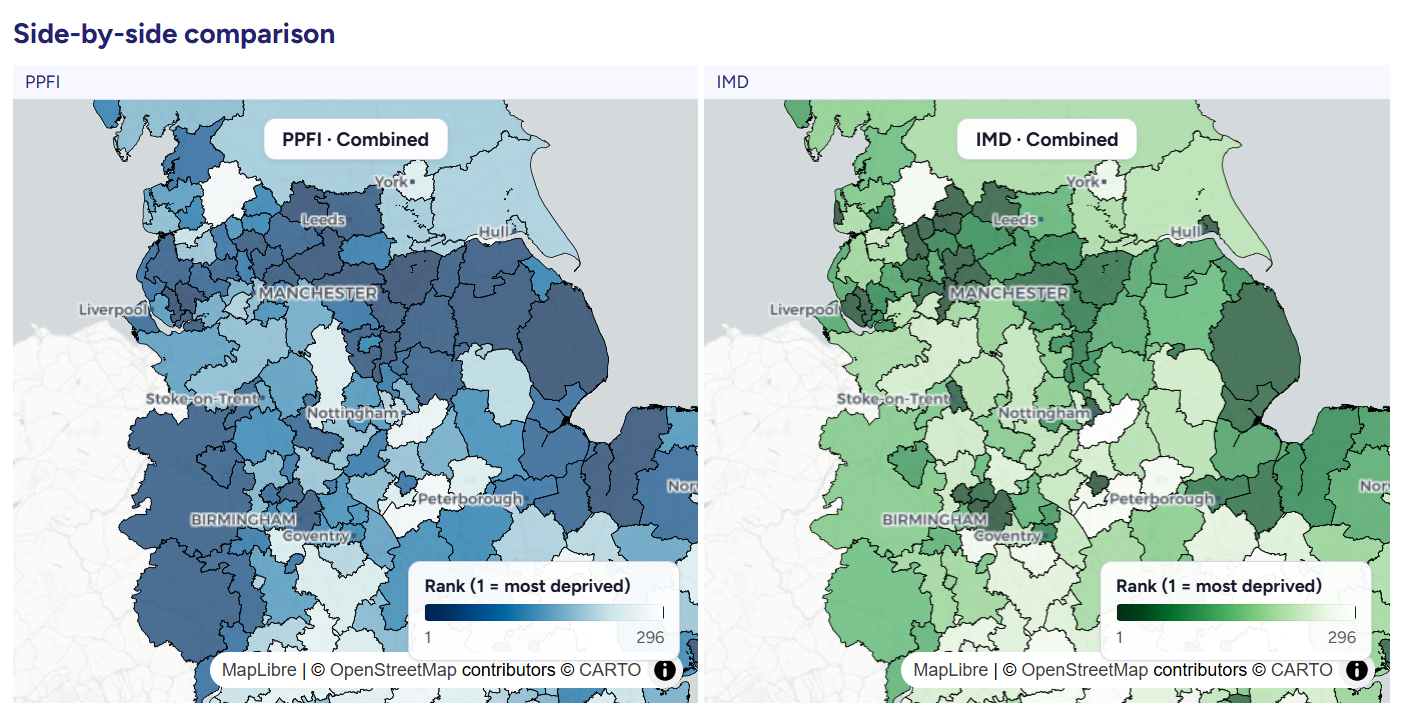
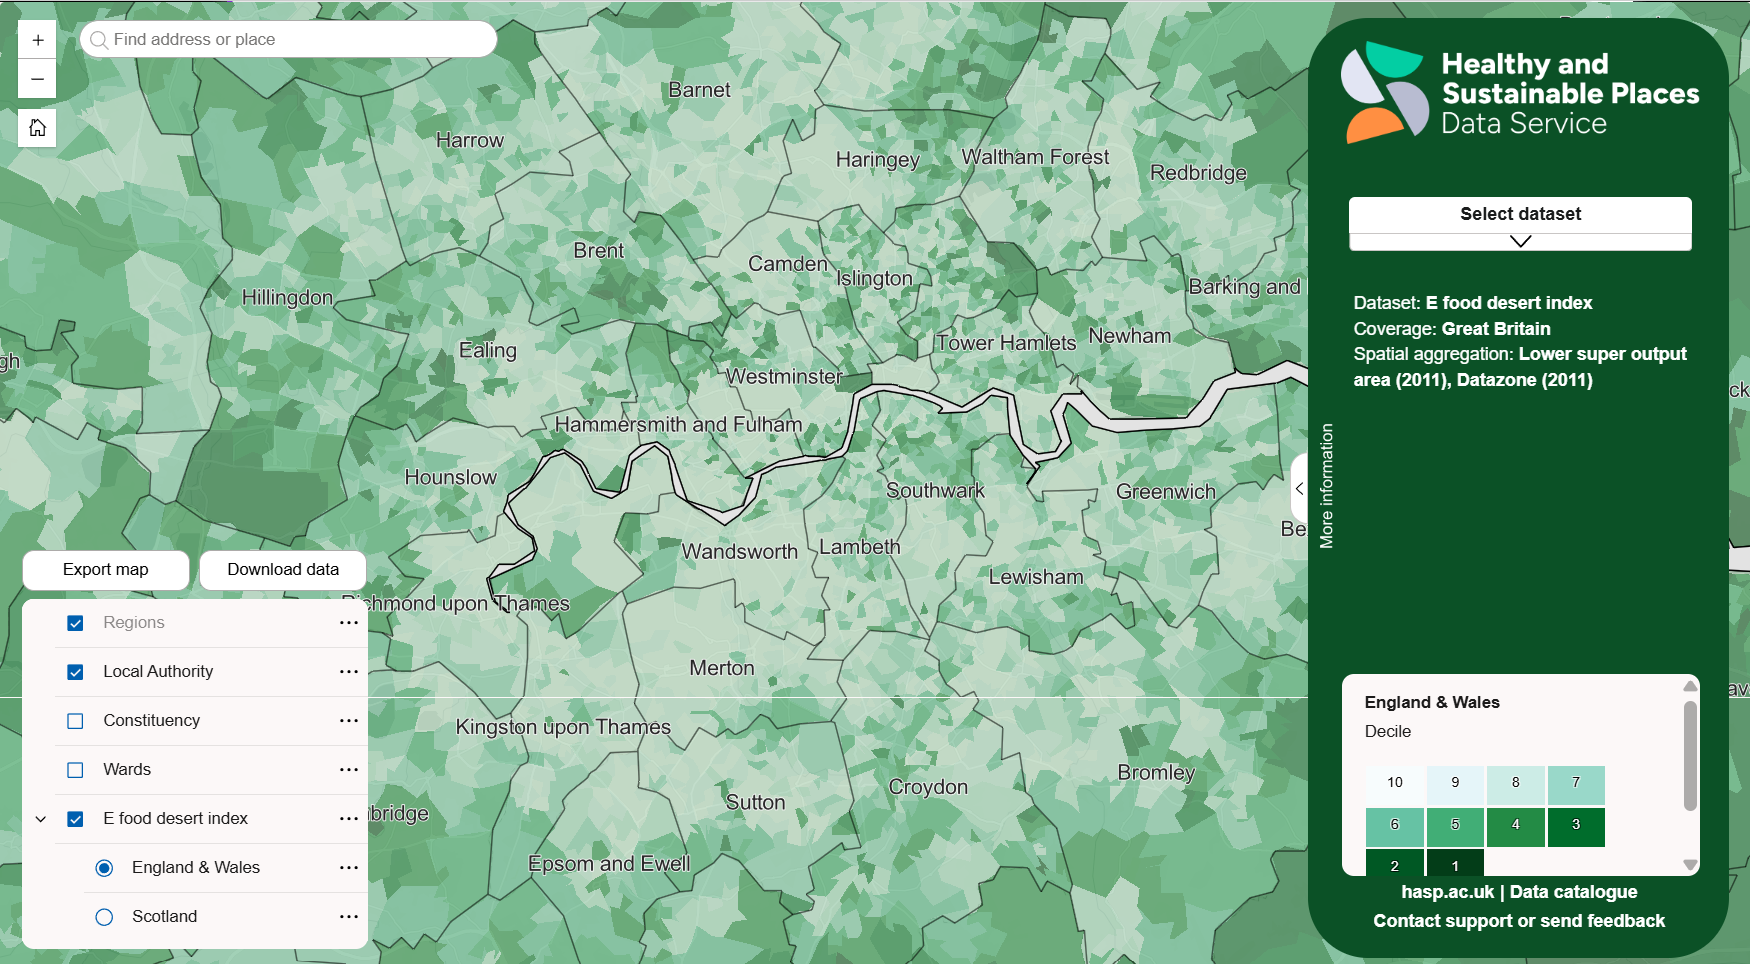
Users can explore the data in two ways – visually via the tool (Local Authority Districts) or by downloading the underlying data (Wards and Local Authority Districts) for their own analysis. The comparison tool allows side‑by‑side analysis of local authorities, making it easier to examine regional disparities and identify areas where outcomes differ markedly.
Key indicators cover themes such as employment, housing and connectivity, helping to build a more rounded picture of local economic conditions.

The indicators draw on data from a range of sources and are available for all Local Authority Districts across Great Britain. By bringing these measures together in a single, accessible tool, the dashboard supports a more consistent and transparent approach to examining how inclusive economic outcomes have varied across places in recent years.
While the data do not reflect the most recent economic conditions, the 2017–2021 time series provides valuable context for understanding longer term trends and pre‑existing inequalities. These data can help highlight persistent challenges and support the evaluation of place‑based policy interventions. The metrics will be updated when newer underlying data become available.
The new dashboard and downloadable data are available now via the Healthy and Sustainable Places Data Service.
Related papers
The paper outlining the conceptualisation of the indicators:Lupton, R., C. Hughes, and N. Lomax. 2023. “SIPHER Inclusive Economy Indicator Set: Technical Paper.”
The paper outlining the construction and use of the indicators:Lomax, N., Rice, H.P., Hoehn, A., Hughes, C., Heppenstall, A., Elsenbroich, C. and Meier, P., 2026. An Inclusive Economy Classification of British Local Authority Districts and Assessment of Its Association With Life Expectancy and Lifespan Variation. Population, Space and Place, 32(1), p.e70151.


")